N1SU APRS Digipeater Packet Propagation and Analysis
N1SU APRS Repeater Packet Propagation and Analysis
Jason Buchanan, N1SU
N1SU-2 APRS repeater is located in Issaquah, WA with general coverage to the northwest,
mainly toward Victoria, British Columbia and stations between.
Visit the N1SU
APRS Dashboard to view real-time packet statistics
APRS Repeater Statistics
Text table showing packet count for a given day where N1SU-2 (144.390 1200) or N1SU-4 (440.800 9600) appears in the packet path, as retransmitted by a distant APRS station.
AG7WT-5, KI7JBV-5, N7RIG-5, and UCAPK operate on 440.800 UHF 9600 baud APRS.
| DATE | SUM | BENSON | ERINB | JUPITR | K7NWS-2 | K7QHQ-12 | KC7NYP | UCAPK | VE7SLC-7 | VE7VIC-15 |
| 6/17 | 15 | - | - | 11 | 3 | - | 1 | - | - | - |
| 6/18 | 14 | - | - | 12 | 1 | 1 | - | - | - | - |
| 6/19 | 36 | - | 1 | 21 | 7 | 3 | - | - | 4 | - |
| 6/20 | 31 | - | 1 | 23 | 5 | 1 | - | - | 1 | - |
| 6/21 | 10 | - | - | 9 | - | 1 | - | - | - | - |
| 6/22 | 54 | - | - | 37 | 15 | 1 | - | - | 1 | - |
| 6/23 | 39 | - | - | 20 | 14 | - | - | - | 1 | 4 |
| 6/24 | 23 | - | - | 16 | 6 | - | - | - | - | 1 |
| 6/25 | 25 | 1 | - | 19 | 3 | - | - | 1 | - | 1 |
| 6/26 | 35 | - | 1 | 26 | 6 | 2 | - | - | - | - |
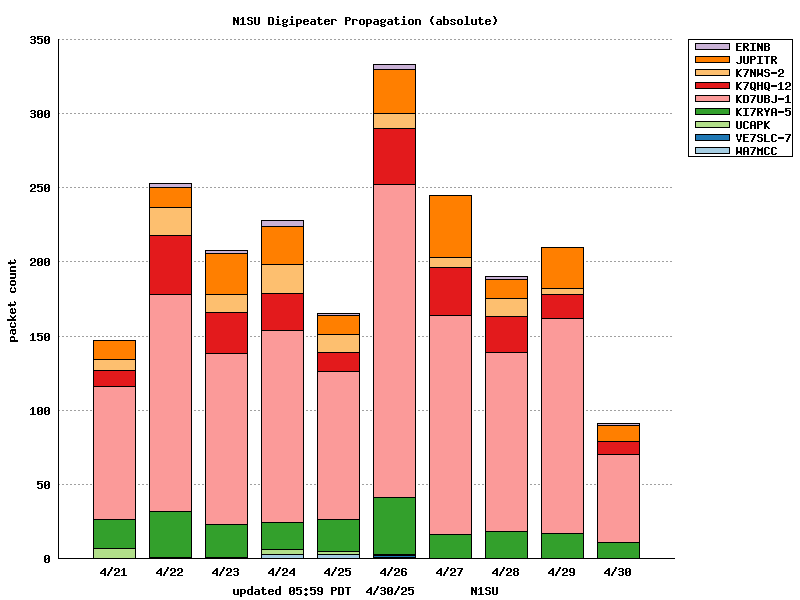
Absolute packet count
The first bar graph shows packet count for a given day where N1SU-2 or N1SU-4 appears in the packet path, as retransmitted by a distant APRS station. The bars are stacked in alphabetical order.
Proportional packet count
The second bar graph shows the same data but as a stacked histogram to show the relative percentage of a station compared to others for a given day.
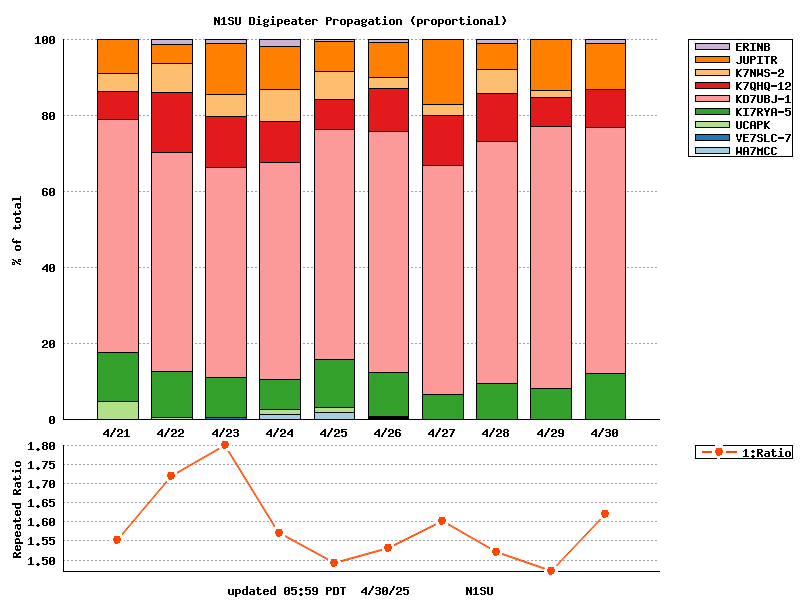
Repeated Ratio is the ratio of packets that were repeated by a distant repeater (see bar graphs) where the N1SU repeater appears in the path of a packet containing one or more remaining hops.
Repeated Ratio of 1.00 indicates that each packet with one remaining hop transmitted by N1SU was retransmitted by a distant repeater; likewise a ratio of 2.00 indicates two different repeaters retransmitted the packet sent by N1SU.
The Repeated Ratio is a means to show the effects of changing TXDelay, RF output power, and other parameters.
Notable observations for supporting optimal communication with my setup (currently TNC-Pi, Icom IC-2200H):
About the graphs
The graphs on this page show APRS packet propagation where the N1SU repeater appears in the packet path.
The source of this data is from the N1SU repeater APRX log.
The data is not filtered or deduplicated.
The graphs are updated at 0:00z (UTC)
The colors and stations are dynamically plotted - over time some will appear, or disappear.
Accuracy is correlated to the captured data over time, and isn't sourced from remote APRS stations.
Numerous factors can reduce packet count, including atmospheric interference, congestion and lack of Carrier Sense Multiple Access (CSMA), multipath, etc. 144.390 is very busy in Seattle.
Repeater packet delay time analysis
Repeater packet repeat delay time for all nearby repeaters:
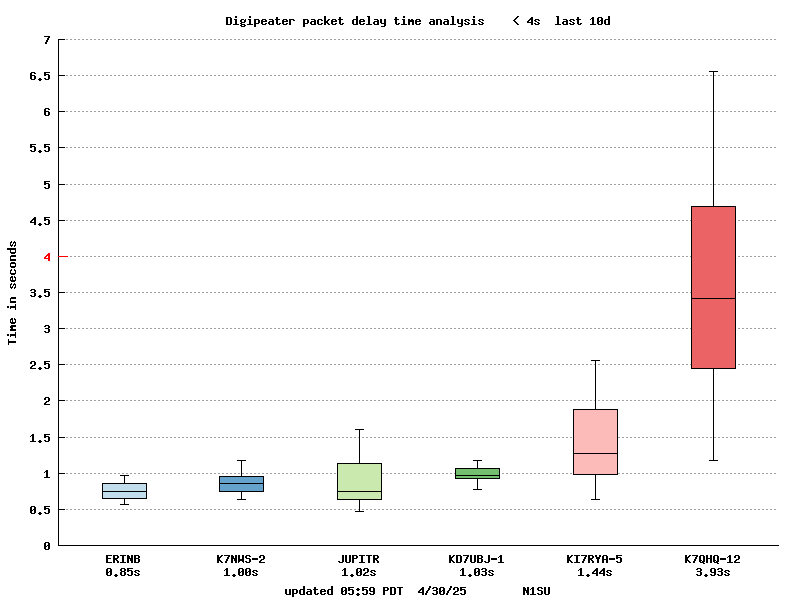
This graph shows, as boxplots, the elapsed time for a repeater to retransmit a packet that it received from an origin station (not from another repeater).
The time is calculated by measuring the elapsed time after the origin station sent its packet and the repeater began to resent it.
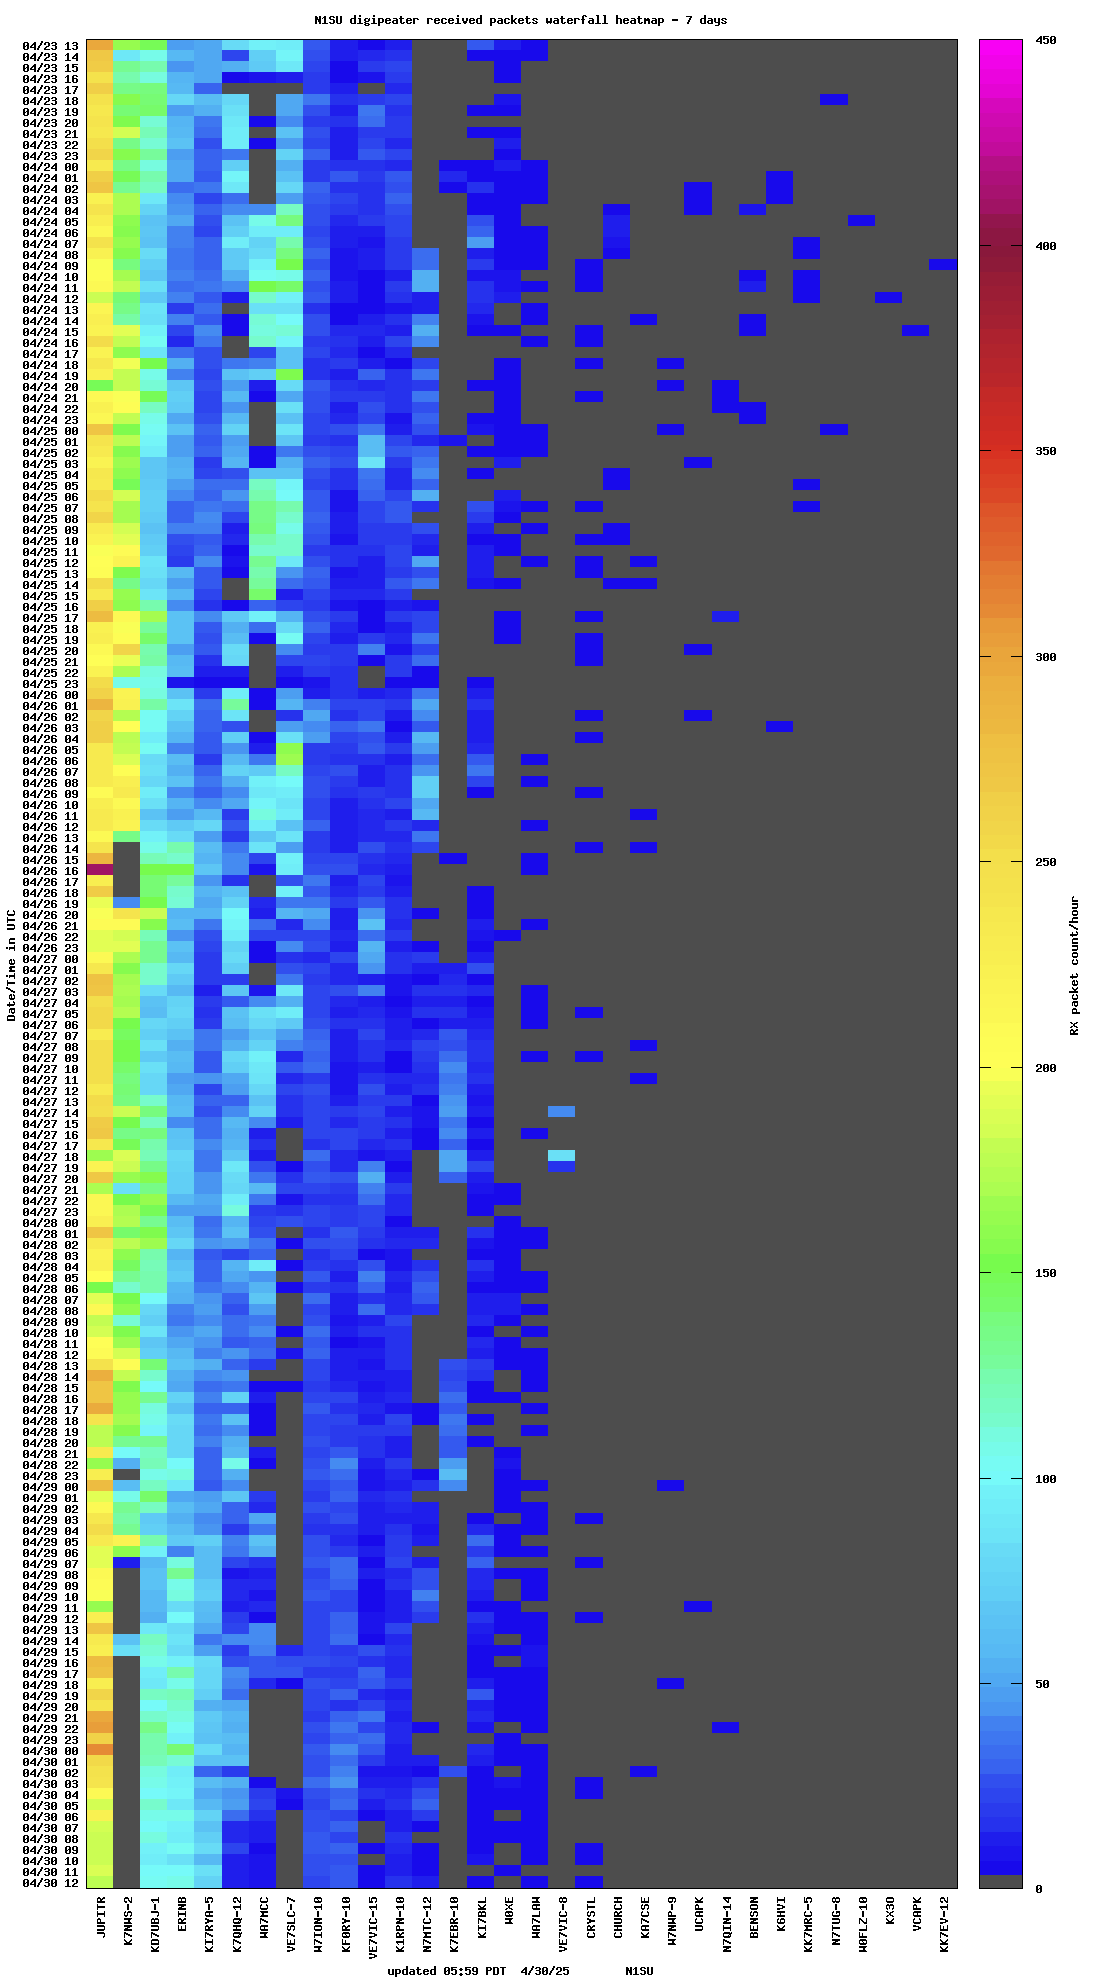
Repeated packets from all nearby repeaters
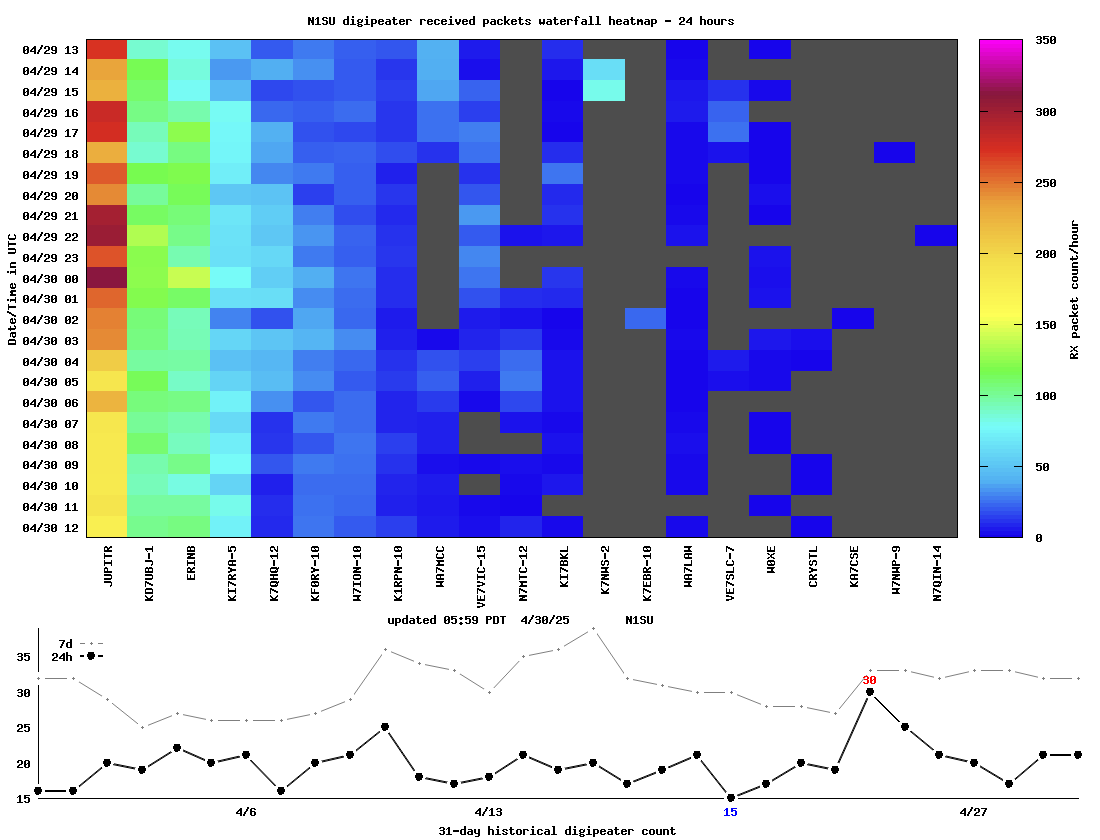
The following two heatmap images show received packet count:
- Repeater name is the X axis
- Date/time is the Y axis (UTC)
- Color represents packet count
- Direct origin station and APRS-IS packets are not counted
- Only packets with 1 or more hops are counted
Interesting for seeing possible tropospheric ducting and the effects on propagation.
This page is still being written/improved so please pardon errors, omissions, etc.
N1SU APRS Repeater Packet Propagation and Analysis - Updated: 26-Jun-26
(C) 2026 jsb@digistar.com
Back to APRS